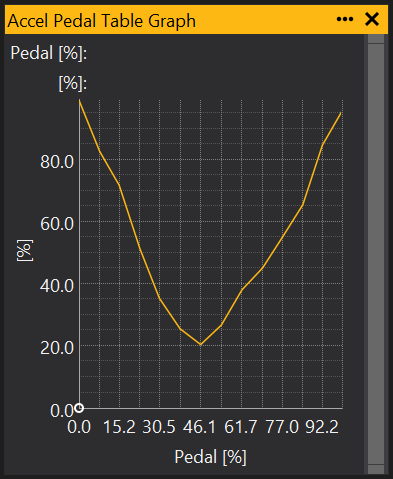
Table Graph
The table graph is a graph representation of table. It can be used to view and edit the values in a table. For how to add objects see the Adding an Object section.


Selecting and Editing the Table Graph
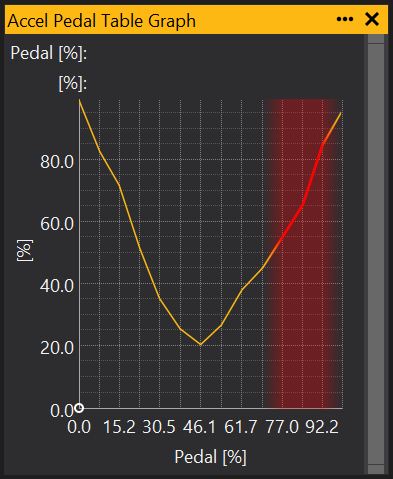
To edit a single point, move the cursor over the line on the graph and click when the cursor changes to a hand icon. Drag up and down to edit the point. To select multiple points, hold down Ctrl and click on the points to be edited. To select a continuous range of points, click and drag the mouse or hold down Shift and use the left and right arrow keys.
When selected, points on the graph will be highlighted like this:


To edit, use [ and ] keys to increment/decrement the selected points.
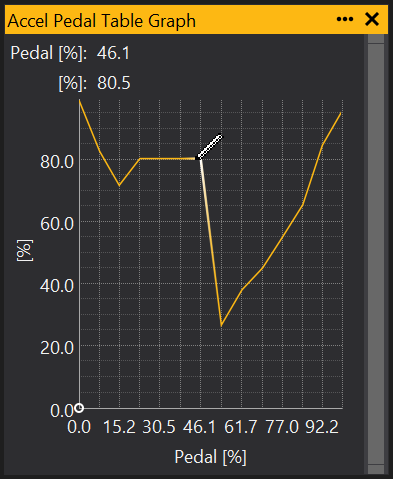
Another method for editing is to hold the Alt key, then click and drag the mouse over the graph to ‘draw’ over all the points on the graph:


Changing the viewable range of values
Using the scroll bar on the right hand side of the graph you can change the range of values being shown by the graph, allowing you for example, to focus on a particular range. Clicking and dragging the top and bottom of the scroll bar changes the upper and lower values for to be displayed by the graph. By then clicking an dragging in the middle of the scroll bar you can adjust the section of this range to focus on.
View Properties
Properties editable via the properties editor.
| Property | Script ID | Description |
|---|---|---|
| Title | title |
The title of the window. |
| Script ID | id |
The scripting ID of the window. Can be used as an alternative to the title for searching for windows from scripts. |
| Tool Tip | tooltip |
Window tool tip. |
| Display Units | display_units_text |
Show units after the number on the view. |
| Display Units (Label) | display_units_label |
Show units after the label on the view. |
| Prefix Text | prefix_text |
Text to display before the value. |
| Postfix Text | postfix_text |
Text to display after the value. |
| Limits | limits |
Set up alarm limits for this gauge. |
| Show Value | show_value |
|
| Show Label | show_label |
|
| Label Font | label_font |
|
| Value Font | value_font |
|
| Value Height % | value_height_percent |
A value of zero disables auto font size fitting if Value Height Max is set |
| Value Height Max [dp] | value_height_max_dp |
Maximum font height of the value text, in device pixels |
| Label Height % | label_height_percent |
|
| Label Height Max [dp] | label_height_max_dp |
Maximum font height of the label, in device pixels |
| Label Text | label_text |
|
| Label Align | label_align |
|
| Label Vertical Align | label_valign |
|
| Value Align | value_align |
|
| Value Vertical Align | value_valign |
|
| Low Limit Text | low_limit_text |
|
| High Limit Text | high_limit_text |
|
| Value Override Text | value_text |
|
| Max length Text | max_length_text |
Leave blank for auto |
| Background | bg_colour |
Background colour |
| Text | text_colour |
Text colour |
| Alarm Low Background | alarm_low_bg_colour |
Alarm Lower Limit Background colour |
| Alarm Low Text | alarm_low_text_colour |
Alarm Lower Limit Text colour |
| Alarm High Background | alarm_high_bg_colour |
Alarm Upper Limit Background colour |
| Alarm High Text | alarm_high_text_colour |
Alarm Upper Limit Text colour |
| Input Value | parameter |
The source of the value that will be displayed by the gauge. |
| Update Rate | update_rate |
Rate at which the input value is requested from the ECU. |
| Decimal Places | decimal_places |
Set to -1 for auto |