Map Graph
The map graph is a 3D representation of a map. It can be use to view and edit sites on the map as well as overlay other objects such as tables and log maps. For details on how to add objects, see the Adding an Object section.
When the map is added to the workspace you will be shown a 3D graph like the following:

Viewing the Map Graph
There are three ways by which you can change the view of the map graph; Zoom, rotate and pan.
Zoom increases or decreases the size of the map graph in its window. To zoom in or out, either use the mouse scroll wheel, or zoom keys (default: z,a).
Rotate changes the angle which you are viewing the map graph. To rotate, hold down the Ctrl key and click and drag with the left mouse button. You can also rotate by holding the Ctrl key and using the arrow keys.
Pan changes the position of the map graph in its window. To pan hold down the Ctrl and Alt keys and click and drag with the left mouse button. You can also pan by holding the Ctrl and Alt key and using the arrow keys.
With all of the above, also holding the Shift key increases the speed at which the view changes.
Selecting and Editing the Map Graph
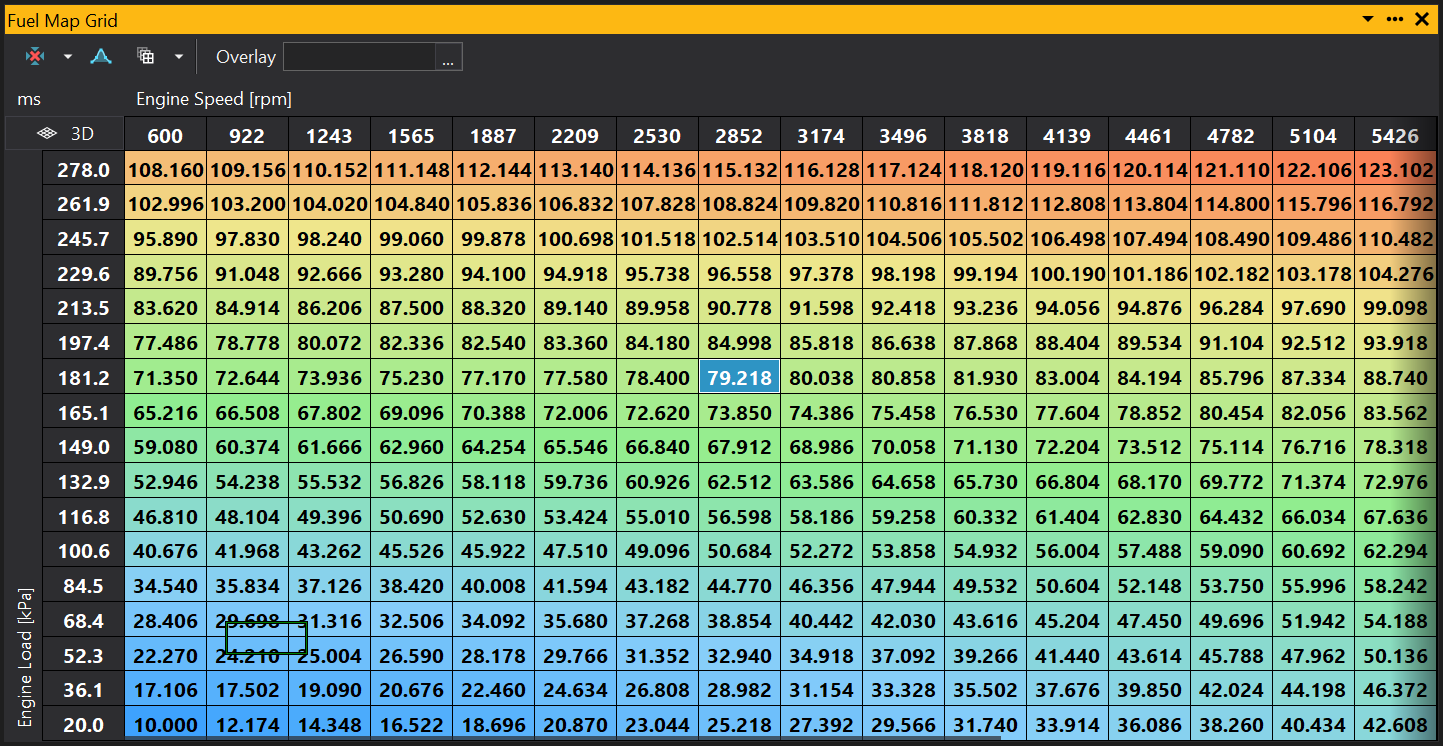
To select a point on the graph, click the point with the left mouse button. To select an area of points, click an drag with the left mouse button. This selection can then be moved around the graph with the arrow keys.
Select the point(s) on the graph to edit their value. This can be done two ways:
-
Incremental increase/decrease: use the [ and ] keys (or + and - on the keypad). Holding Shift when using these keys changes the value by larger increments.
-
To a set value: Just start typing a number with points selected and a box will appear showing your number. Enter the correct value and press enter.
It is also possible to copy and paste a selection from another graph or grid. To do this, select a point or area on another graph or grid, right click and select copy (or Ctrl+C), then select the point or area on the current graph you want to paste in to, right click and select paste (or Ctrl+V).
Changing the look of the Map Graph
It is possible to change the way the map graph looks in a multitude of ways. For instance you can remove the grid, change the gradient colour, or change the lighting.
To change the colour of the map graph, from the Menu select: Configure | Preferences. In the preference window select the colours section. Find the option called ‘Map Graph Fill’. From here you can select from many different gradients or create your own.
All other changes are made in the properties of the map graph. By default the properties window is displayed to the left of the workspace, if it is not shown you can right click on the map graph and select properties. The properties for the map graph will then be displayed. An explanation of each option is displayed at the bottom of the properties window, when the property is selected
For more on the properties window, see the Properties Window section.
Soft selections
Soft selection makes it possible for smooth transitions between the areas on the graph that are being edited at those that are not. Soft selection increases the currently selected area out in all directions. Points closer to the selected area will be more affected by any changes than those further away. The amount these areas are affected is controlled by the dial at the bottom of the graph labeled ‘Select Range’. The higher the value of this dial the larger the area of the soft selection. The smaller the value, the smaller the area of the soft selection. When the dial is at is minimum soft selection is turned off. Soft selected points are defined by red points which fade out as the selection decreases.
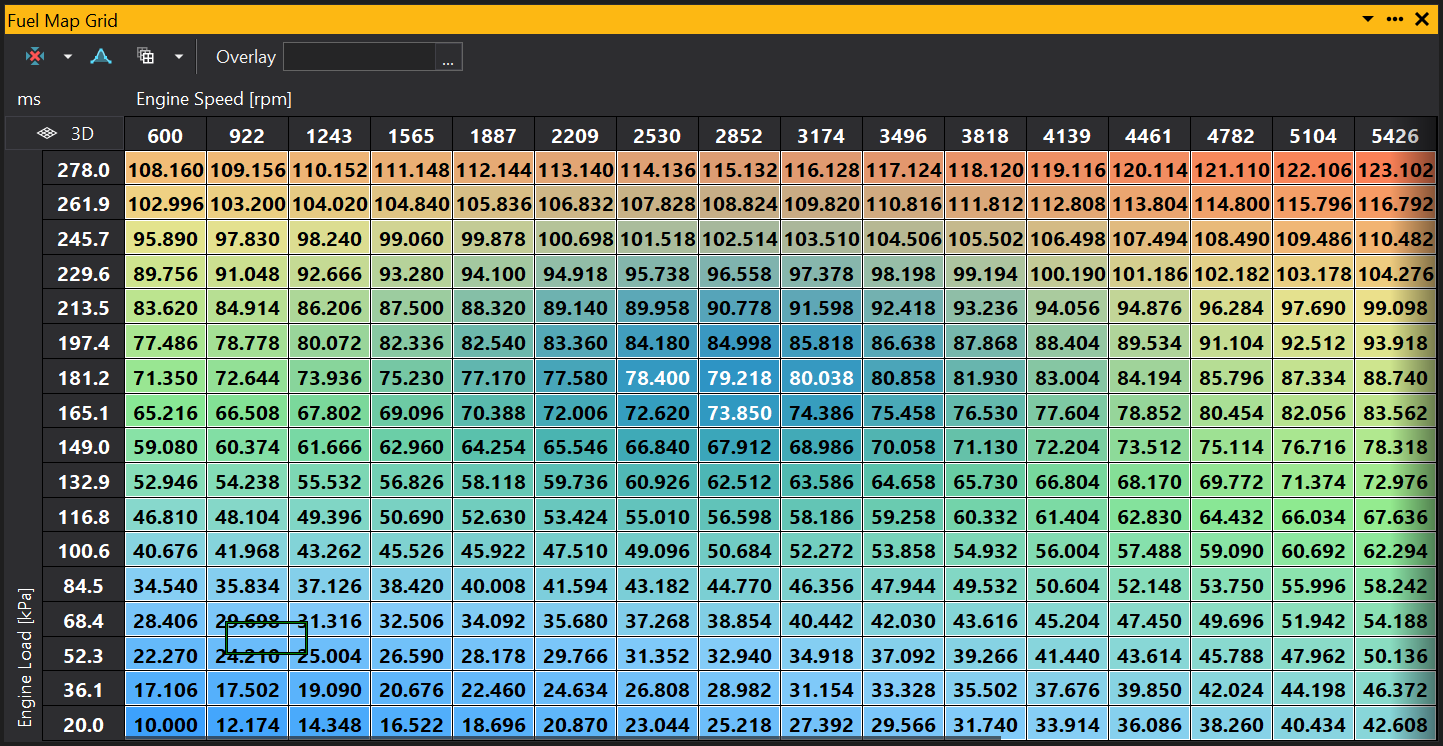
Here you can see a cell selection with soft select turned off:
The following shows and example of editing a grid with soft selection on:
Note
The single ‘hard’ selected point in in the center, and the soft selected points gradually fade out around it.
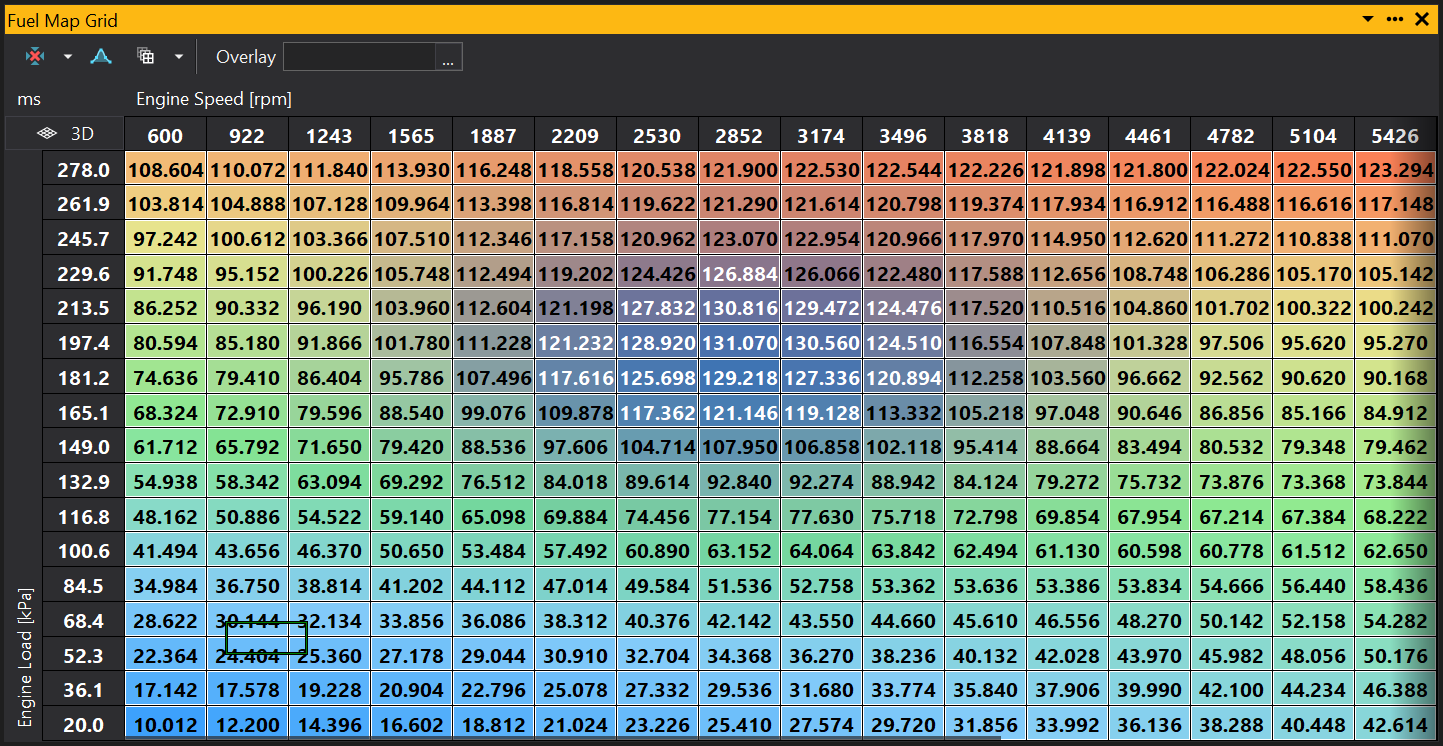
Now that the point has been edited, the points that are soft selected around it have also been affected.
Overlays
The overlay option allows you to view another map or Log Map overlayed on top of the current graph, viewed as colour change. To do this click the ‘…’ button to the right of the overlay box and select another map from the list provided. When selected the name of the map being overlayed will be displayed in the overlay box and the colours of the graph will have changed to represent the changes in the overlayed map. The key on the map will also change to display the range of values in the overlayed map.
Follow ECU
When connected to an ECU the Follow ECU option sets the selected site on the graph to the currently active site. For example, using a Fuel Map, if the car is at 5000rpm and at 100kpa load then this position is selected on the Fuel Map.
Map Graph Functions
See section Map & Table Functions
View Properties
Properties editable via the properties editor.
| Property | Script ID | Description |
|---|---|---|
| Object | object |
Name of the object displayed by this view. |
| Title | title |
The title of the window. |
| Script ID | id |
The scripting ID of the window. Can be used as an alternative to the title for searching for windows from scripts. |
| Tool Tip | tooltip |
Window tool tip. |
| Show Gradient Bar | show_gradientbar |
Display the gradient bar. |
| Show Axis Legend | show_axis_legend |
Display the axis legend. |
| Show Axis Labels | show_axis_labels |
Display axis labels. |
| Show Value Labels | show_value_labels |
Display value labels. |
| Show Trails | motion_trails |
Display trails of where the site position has been over time when online. |
| Trail Time [s] | motion_trail_time |
Time that motion trails display for when online, in seconds. |
| Trails Infinite Time | motion_trail_infinite |
Motion trails set to infinite time. |
| Lighting | lighting |
Enable / Disable directional lighting |
| Perspective | perspective |
Change the projection mode (Perspective / Orthographic) |
| Fill | fill |
Display a filled surface on the map |
| Wireframe | wireframe |
Display lines between each site n the map |
| Bounding Box | bounding_box |
Display a box around the extents of the map |
| Shadow | shadow |
Display a shadow at the base of the map |
| Colour | colour |
Enable colour mapping of site or overlay site value |
| Colour Mode | colour_mode |
Control how colours are displayed for this object. |
| Smooth Shading | smooth_shading |
Enable smooth Gouraud shading (only works if lighting enabled) |
| Antialiasing | antialiasing |
Enable anti-aliased lines (smooths out jagged edges) |
| Show Axes | show_axes |
Display X, Y and Z axes and labels |
| Show Grid | show_grid |
Display grid lines for axes |
| Show ECU Position | show_ecu_position |
When online, display the current 'position' of the ECU based on the axis input channel(s) for the viewed object |
| Translucent Cursor | translucent_cursor |
Draw translucent planes through the cursor axes |
| Cursor Sphere | cursor_sphere |
Draw a sphere at the cursor position |
| Cursor Lines | cursor_lines |
Draw lines at the cursor position |
| Cursor Cross | cursor_cross |
Draw a cross at the cursor position |
| Trails on Fill | trails_on_fill |
Draw map trails on the fill rather than on the wireframe |
| Link Selection | link_selection |
Links the selection with views of the same object (e.g. links the selection on map grid and graph views). |
| Selected | selected |
Selected sites. |
| Soft Selection Range | range |
Sets the falloff range of partially selected points. |
| Follow ECU Mode | follow_mode |
Follows the current site with the selection. |
| Selection Lines | selection_lines |
Draw thick lines around selected sites |
| Small Increment | increment_small |
Sets the small increment / decrement value for keyboard control with '[' and ']' keys. |
| Large Increment | increment_large |
Sets the large increment / decrement value for keyboard control with Shift-'[' and Shift-']' keys. |
| Is Scaled Increment | increment_real |
If set to 'Yes', uses the small/large increment to increment the scaled (real) value rather than the raw integer value. |
| Invert X | invert_x |
Inverts the X axis. |
| Invert Y | invert_y |
Inverts the Y axis. |
| X Scale Mode | mode_x |
Defines how the X axis is scaled |
| Y Scale Mode | mode_y |
Defines how the Y axis is scaled |
| X Range | range_x |
Sets the size of the X axis. |
| Y Range | range_y |
Sets the size of the Y axis. |
| Z Range | range_z |
Sets the size of the Z axis. |
| Decimal Places X | decimal_places_x |
Overrides automatic decimal places (X-axis). Does not have an effect on integer values. |
| Decimal Places Y | decimal_places_y |
Overrides automatic decimal places (Y-axis). Does not have an effect on integer values. |
| Decimal Places Z | decimal_places_z |
Overrides automatic decimal places (Z-axis). Does not have an effect on integer values. |
| Graph Gradient | gradient_graph |
Gradient used for the map surface |
| Background | colour_bg |
Background colour for the map |
| Solid Fill | colour_solid |
Solid fill colour for the map |
| Wire | colour_wire |
Wireframe colour for the map |
| Text | colour_text |
Text colour for the map |
| Text Shadow | colour_text_shadow |
Text shadow colour for the map |
| Wire (No Fill) | colour_wire_no_fill |
Wireframe colour for the map when fill is disabled |
| Wire Selected | colour_wire_selected |
Wireframe colour for the map when selected |
| Wire (No Texture) | colour_wire_no_texture |
Wireframe colour for the map when texture is disabled |
| Wire Selected (No Texture) | colour_wire_selected_no_texture |
Wireframe colour for the map when selected and texture is disabled |
| Overlay | overlay |
Selects an object to overlay colour on the grid. |
| Range Mode | range_mode |
Changes the axis scale limits: Preferred: Equivalent to 'Auto'. None: Uses the full range. Auto: Scales to fit. Fixed: The default value, fixed at the range defined in the GIN file, or the full range if not defined. User: User defined minimum and maximum. |
| Minimum | range_min |
Minimum for user defined range. Range Mode must be set to "User". |
| Maximum | range_max |
Maximum for user defined range. Range Mode must be set to "User". |
| Show Normals | show_normals |
Display normal vectors from verticies on the map (development use) |
| Specular | specular |
Enable specular lighting |
| Light1 X | light1x |
|
| Light1 Y | light1z |
|
| Light1 Z | light1z |
|
| Light0 Ambient | light0ambient |
|
| Light0 Diffuse | light0diffuse |
|
| Light0 Specular | light0specular |
|
| Light1 Ambient | light1ambient |
|
| Light1 Diffuse | light1diffuse |
|
| Light1 Specular | light1specular |
|
| Model Ambient | model_ambient |
|
| Material Ambient | material_ambient |
|
| Material Diffuse | material_diffuse |
|
| Material Specular | material_specular |
|
| Material Emission | material_emission |
|
| Material Shininess | material_shininess |