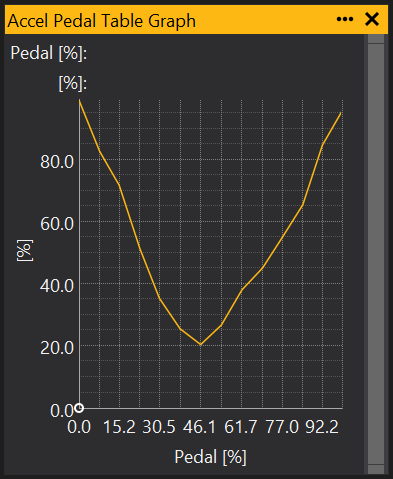
Table Graph
The table graph is a graph representation of table. It can be used to view and edit the values in a table. For how to add objects see the Adding an Object section.
Selecting and Editing the Table Graph
To edit a single point, move the cursor over the line on the graph and click when the cursor changes to a hand icon. Drag up and down to edit the point. To select multiple points, hold down Ctrl and click on the points to be edited. To select a continuous range of points, click and drag the mouse or hold down Shift and use the left and right arrow keys.
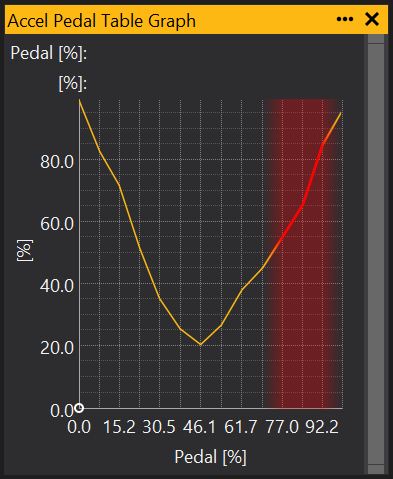
When selected, points on the graph will be highlighted like this:
To edit, use [ and ] keys to increment/decrement the selected points.
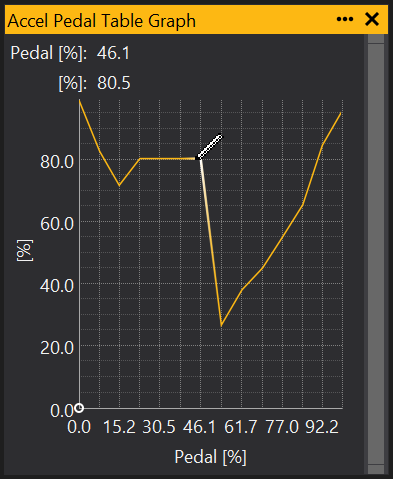
Another method for editing is to hold the Alt key, then click and drag the mouse over the graph to ‘draw’ over all the points on the graph:
Changing the viewable range of values
Using the scroll bar on the right hand side of the graph you can change the range of values being shown by the graph, allowing you for example, to focus on a particular range. Clicking and dragging the top and bottom of the scroll bar changes the upper and lower values for to be displayed by the graph. By then clicking an dragging in the middle of the scroll bar you can adjust the section of this range to focus on.
View Properties
Properties editable via the properties editor.
| Property | Script ID | Description |
|---|---|---|
| Object | object |
Name of the object displayed by this view. |
| Title | title |
The title of the window. |
| Script ID | id |
The scripting ID of the window. Can be used as an alternative to the title for searching for windows from scripts. |
| Tool Tip | tooltip |
Window tool tip. |
| Interpolation Mode | interp |
Sets the visual interpolation mode of the graph. |
| Link Selection | link_selection |
Links the selection with views of the same object (e.g. links the selection on map grid and graph views). |
| Selected | selected |
Selected sites. |
| Soft Selection Range | range |
Sets the falloff of partially selected points. |
| Follow ECU Mode | follow_mode |
Follows the current site with the selection. |
| Background Select | background_mode |
Displays the selected sites with a colour in the background. |
| Small Increment | increment_small |
Sets the small increment / decrement value for keyboard control with '[' and ']' keys. |
| Large Increment | increment_large |
Sets the large increment / decrement value for keyboard control with Shift-'[' and Shift-']' keys. |
| Is Scaled Increment | increment_real |
If set to 'Yes', uses the small/large increment to increment the scaled (real) value rather than the raw integer value. |
| Axis Lookup Mode | axis_lookup_mode |
Lookup mode for the ECU position indicator when online. |
| Range Mode | range_mode |
Changes the axis scale limits: Preferred: Equivalent to 'Auto'. None: Uses the full range. Auto: Scales to fit. Fixed: The default value, fixed at the range defined in the GIN file, or the full range if not defined. User: User defined minimum and maximum. |
| Minimum | range_min |
Minimum for user defined range. Range Mode must be set to "User". |
| Maximum | range_max |
Maximum for user defined range. Range Mode must be set to "User". |
| Rescale When Drawing | rescale_when_drawing |
Rescales the axis immediately when drawing with the mouse. |
| X Scale Mode | mode_x |
Defines how the X axis is scaled |
| Decimal Places X | decimal_places_x |
Overrides automatic decimal places (X-axis). Does not have an effect on integer values. |
| Decimal Places Y | decimal_places_y |
Overrides automatic decimal places (Y-axis). Does not have an effect on integer values. |