Functions
Overview
Various functions are available for map and table editing from the context menu.
Various functions are available for map and table editing from the context menu.
Allows a user defined function to be performed on the selected sites.
The function can also be referred to as a script.
Simple functions may be written much like a mathematical expression, so no expert knowledge of programming is required.
For example, to make a percentage change of sites in a map, you might write:
v \* 0.1
If you click ‘Apply’, the function will be applied to the sites in the map. If you want the function to be applied to all sites, uncheck the “Apply to Selection” box.
See also Example Function Scripts.
The language used for scripts is “ECMA Script” and there are many resources on the web on its usage:
http://www.w3schools.com/JS/default.asp
http://en.wikipedia.org/wiki/JavaScript
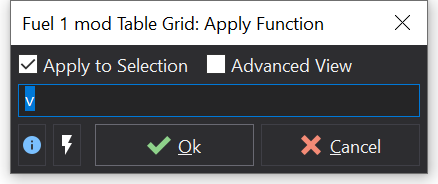
The function editor can be opened by first selecting a channel, map, option, etc and then pressing Ctrl+F
By default, the function editor will display in a simple view mode. This offers an immediate method of entering simple mathematical operations. Pressing the Return key will apply the function and close the window.
If you check the ‘Advanced View’ check box, then you can enter more complicated multi-line scripts.
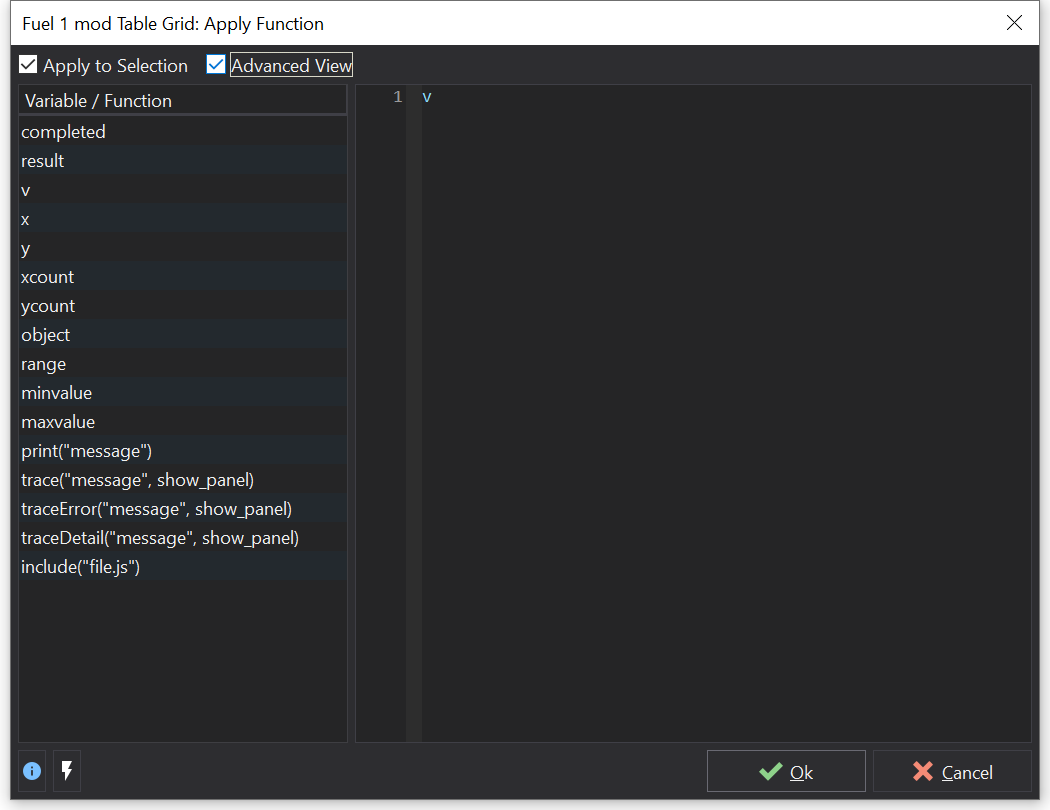
You can write very complicated scripts if you need to that apply functions taking into account all of the sites in the map. Scripts can contain function definitions and may include additional script files from the files system via the ‘include’ function.
Objects and functions defined by GWv4 are listed on the left hand side of the function editor window, along with a brief description of their purpose. To add one of these items at the current cursor location in your script, double click on the item in the list or simply type it in. Variable and function names are case-sensitive.
If you do not set the ‘result’ value, then the site will be set to the value of the last expression in the script.
There are too many predefined functions and objects within the scripting language to list here.
Of most use in this context are the Math functions and constants:
http://www.w3schools.com/jsref/jsref_obj_math.asp
For example, the screenshot above shows the use of the Math.log function. This is the base 10 logarithm of the value supplied.
Trigonometric and exponentiation functions are also available, as are functions to generate absolute values.
The ‘object’ variable represents the object that you are performing the function on. For example, this could be a table or a map.
Such objects have member functions to adjust the value of specific sites:
thing.getReal(x, y);
thing.setReal(value, x, y);
See also Example Function Scripts.
Fills the map between selected sites or sites with the ‘calibrated’ state (see the ‘State > Set to ‘Calibrated’ context menu command).
To simply interpolate a rectangular selection, use the Interpolate functions.
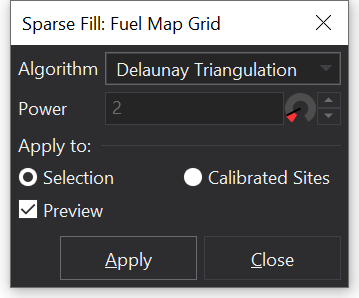
There are different algorithms available for filling the map. Which algorithm you choose to use will depend on your purpose.
The Delaunay Triangulation will generally give the best results but it does require at least three sites to be selected.
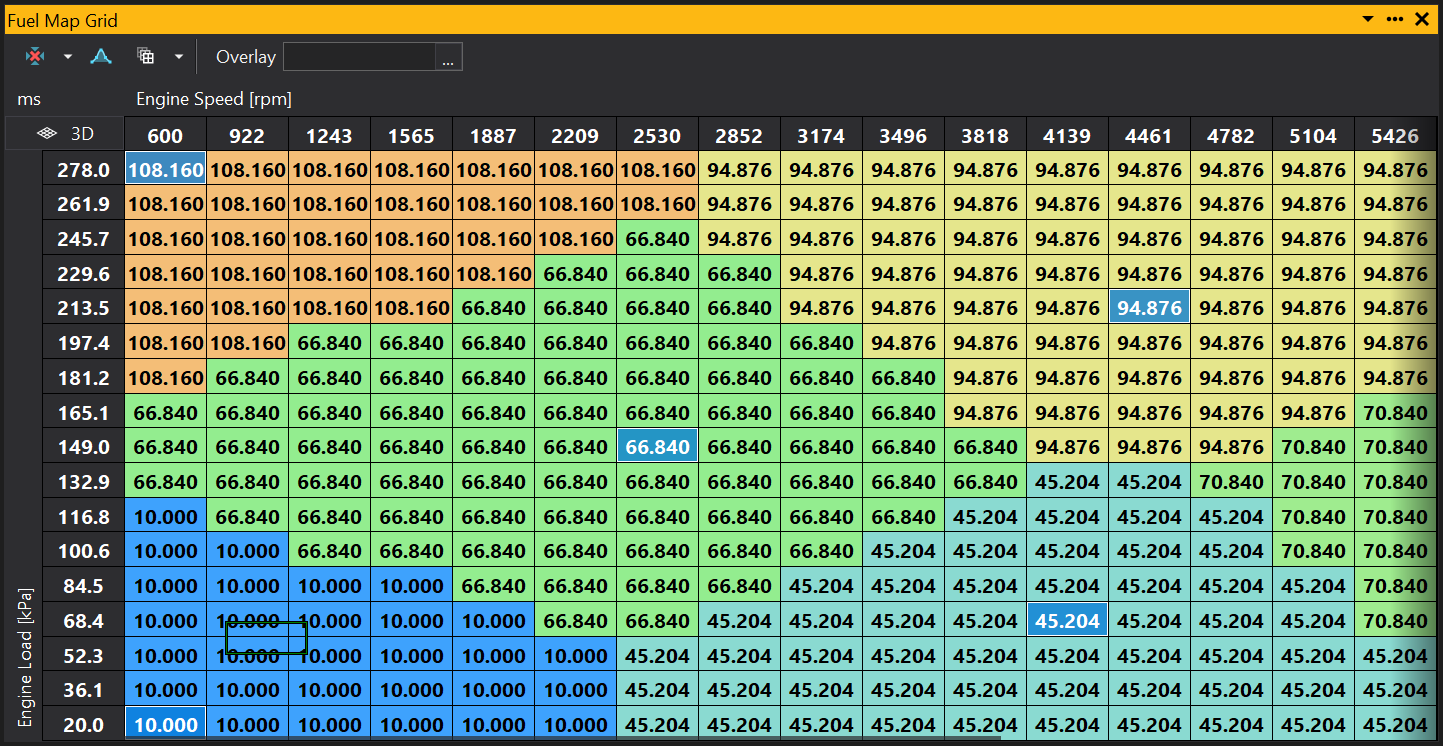
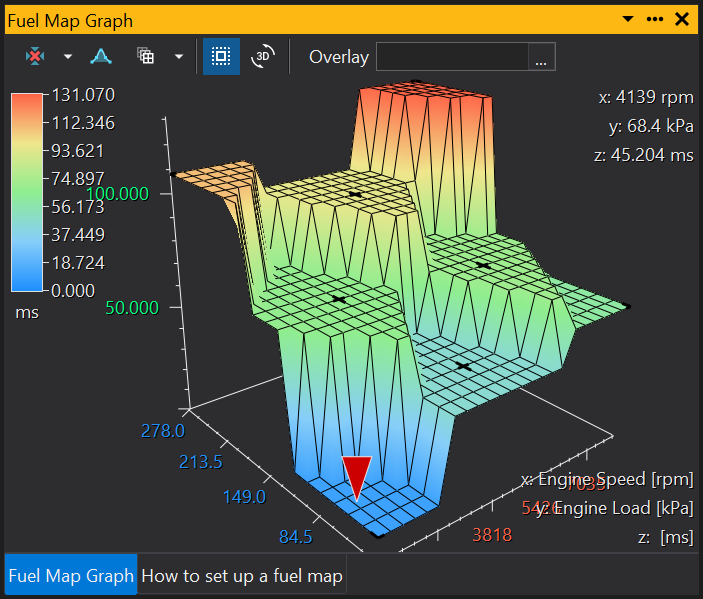
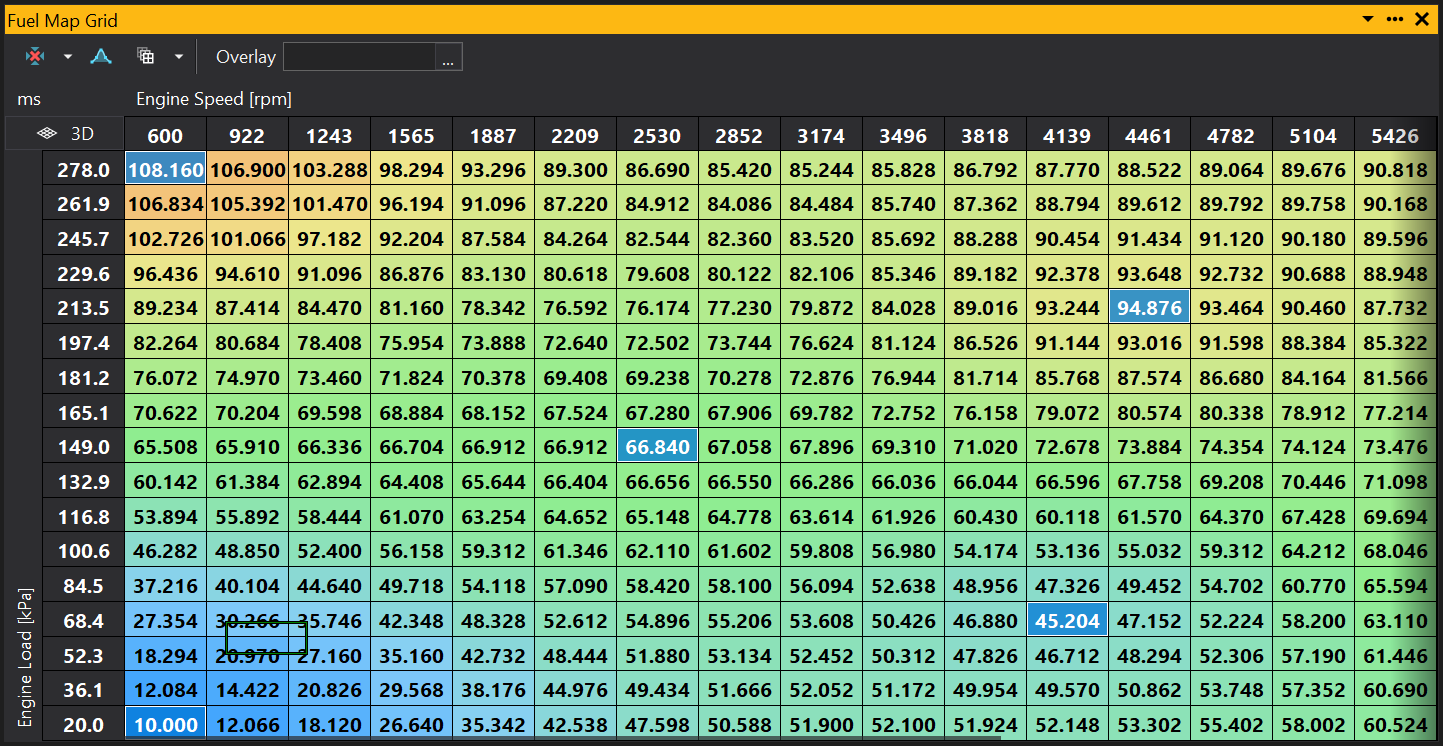
Starting with the following map, a number of sites have been selected by Ctrl-Clicking on the map to generate a ‘sparse’ selection.
The fill algorithms will be discussed with this as a reference.
Our intention is to fill the map sites between the selected sites (i.e. fill the non-selected sites).


For each unselected site in the map, the closest selected site is found and the site value is set to match.
Using our example map above, you would get the following result:
For each site in the map, the site is given a value based on the inverse of the distance from surrounding selected sites.
The ‘power’ channel adjusts the weighting value and will affect the curvature of the resulting map surface.
Using our example map above, you would get the following result:
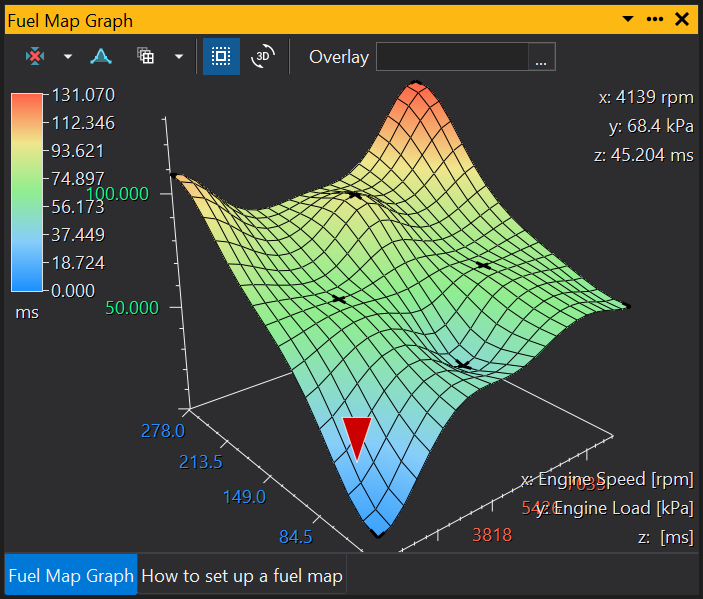
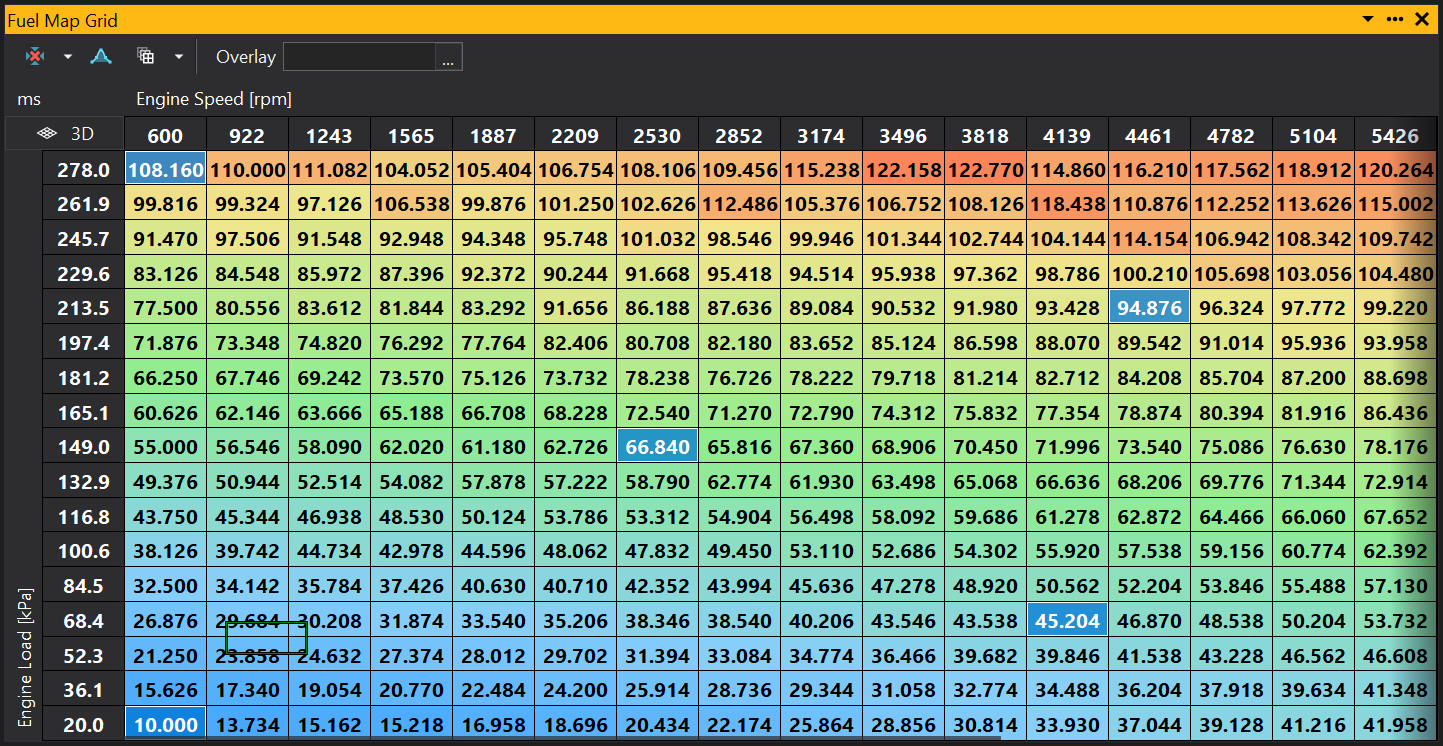
This algorithm triangulates between the selected sites. It finds the most appropriate triangles to use using the Delaunay algorithm (more information is available on the web).
You must have at least three sites selected to use this algorithm and it is recommended that you always select the corner sites because they will not be extrapolated.
There may not always be an appropriate triangulation and in such cases some areas may be missed on the map (for example if you have three collinear points). If this occurs, try modifying your selection or manually adjust the missing areas.
Using our example map above, you would get the following result:
Example scripts for the function editor.
To generate an exponential axis on a map or table, you could use the following script:
var power = 2;
var m = x / (xcount - 1);

minvalue + range * Math.pow(m, power);
Adjusting the ‘power’ variable will adjust the curvature of the resulting axis:
power = 1.5
power = 2
To calculate the average of all sites and display it without modifying the map , you could use the following script.
This shows some more advanced scripting features.
// Loop over all sites and calculate a rolling average
let avg = 0;
let n   = 0;
let val = 0;
for (y = 0; y < ycount; ++y) {
    for (x = 0; y < ycount; ++y) {
        ++n;
        val = object.getReal(x, y);
        avg += (val - avg) / n;
    }
}

print("Average Value: " + avg.toString());
// Terminate the script:
completed = true;

// Set the result so that the object is not modified.
result = v;
This will display the average value of the map in a popup dialog box.
Various functions are available for map and table editing from the context menu.
To access the context menu, right click on the view (e.g. a Map Grid).
Alternatively, press the Context Menu key (to the right of Alt-Gr) whilst the view is focused. Some keyboards do not have a context menu key, in which case you can use Shift-F10.
The context menu differs if you right click on the map/table axes of a grid view.
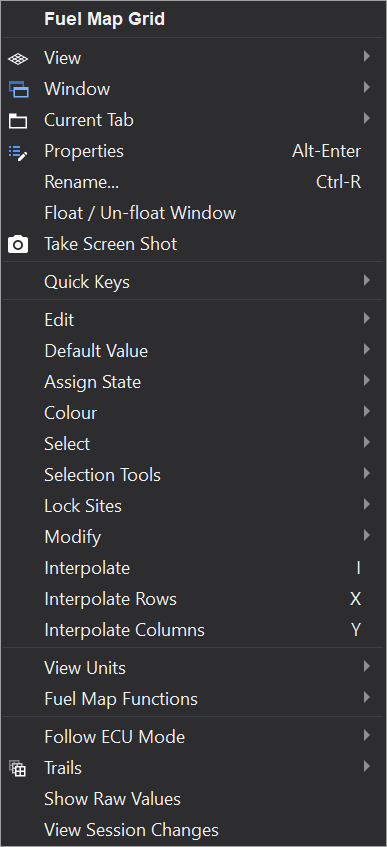
For Fuel Map specific function, see the Fuel Map Functions section.
Creates a new view window in the current tab for the same object (e.g. Fuel Map) with the alternative view type.
Displays/focuses the properties window for this object. Properties will be automatically updated to reflect what you are looking at. If the properties windows is hidden, then it will be shown.
Allows you to modify the title of the window.
Selects all sites in the focused object.
Clears the selection in the focused object.
Clipboard handling for the selected sites. Clipboard data may also be pasted into applications such as Microsoft Excel® and Open Office Calc®.
Adjusts the state of the sites to either ‘Calibrated’ or ‘Unchanged’. To see state colours for a map or table, adjust the colour mode property using the properties window.
Locks sites that have the calibrated state from being modified.
For example, if you has set the state of a number of sites to ‘calibrated’, select all sites in the map and then adjust them using the [ or ] keys, the calibrated sites will not be modified.
Performs a two dimensional linear interpolation between the corner values of the selection.
Performs a one dimensional linear interpolation across rows or columns in the selection.
Adjusts the selected sites by a percentage of the current value:
x = x + (x \* percentage / 100)Negative percentages may be supplied to cause a reduction in the site values.
Adjusts the selected sites by an absolute value:
x = x + valueAllows a user defined function to be performed on the selected sites.
The function can also be referred to as a script.
Simple functions may be written much like a mathematical expression, so no expert knowledge of programming is required.
For example, to make a percentage change of sites in a map, you might write:
v * 0.1If you click ‘Apply’, the function will be applied to the sites in the map. If you want the function to only be applied to the selection, tick the “Apply to Selection” box.
For more details, see the Function Editor section.
Smooth applies a linear phase low pass filter to the map or table.
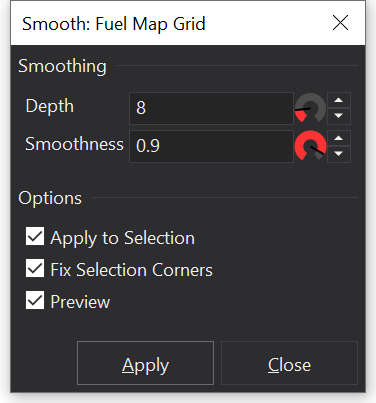
Depth corresponds to the window size of the filter kernel (each site being a sample). A Higher value will allow lower cutoff frequencies.
Smoothness corresponds to the cutoff frequency of the low pass filter. Higher values represent a lower cutoff.
Fills the map between selected sites or sites with the ‘calibrated’ state (see the State | Set to ‘Calibrated’ context menu command).
For more information, see the Fill Function section.
Displays the values in the map or table as raw (unscaled) hexadecimal values.
See also the Fuel Map Functions section.
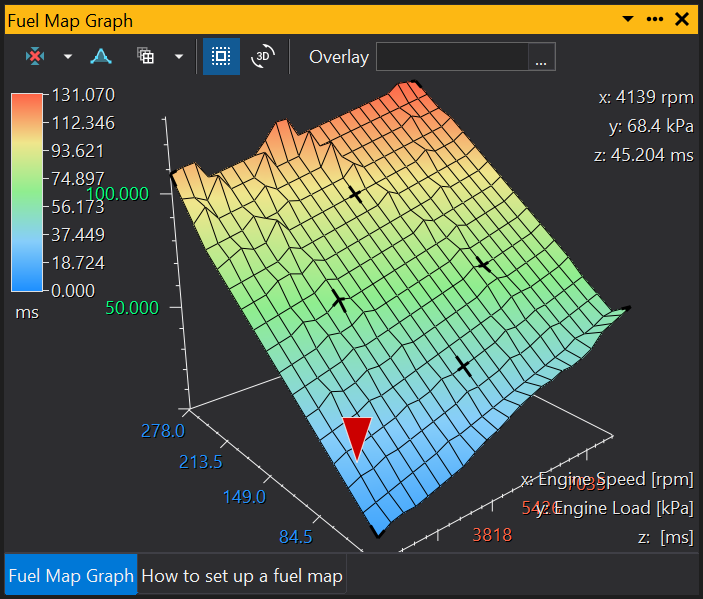
The Fuel map has some specific view options and functions. These are accessible from the context menu.
To access the context menu, right click on the view (e.g. a Map Grid).
Alternatively, press the Context Menu key (to the right of Alt-Gr) whilst the view is focused.
Some keyboards do not have a context menu key, in which case you can use Shift-F10.
Displays the Fuel Map in raw values.
Displays the Fuel Map in terms of injector pulse width in milliseconds.
The value is based upon the Microsec/Bit (or MSPB) option and the LD0MPC option.
The scaling is as follows:
load_scaling = (load_site / load_site_max) + ((load_site_max - load_site) / load_site_max) * ld0mpc / 256;
value = (mspb / 1000) \* load\_scaling;
Try setting the Fuel Map to 255 in raw mode and then switching to pulse-width mode and adjusting the LD0MPC option to get an idea of how ld0mpc affects the scaling of the map.
Displays the map in terms of the duty cycle of the injector pulse train. Duty Cycle is the fraction of time that the injector is active as a percentage, so a duty cycle of 100 or greater indicates that the injector is permanently on.
Like pulse-width, the duty cycle view uses the LD0MPC option to scale the map based upon the load site. However, the scaling also takes into account the speed axis.
Try it out on a map where all the raw values are the same and adjust LD0MPC to see the effect.
When viewing in Duty Cycle, you will be asked what kind of engine you are running in order that duty cycle can be correctly calculated.
Rescaling the Fuel Map adjusts the raw values of the map so that they use the full range of the Fuel Map. In order to preserve the injector pulse-width, the Microsec/Bit (MSPB) option is adjusted to account for the changes to the base map.
Optimizing the Fuel Map adjusts MSPB, LD0MPC and the Fuel Map.
The optimize procedure finds the average slope of the map and removes it by adjusting LD0MPC. This is based on the general trend of fuel maps increasing in value as load increases. The map is also scaled to give maximum fueling resolution.
Generally Optimize is not necessary on engines tuned for Rally.
Performs the reverse of the optimize function and removes any LD0MPC scaling. The Fuel Map is also rescaled to normalize the values.
If you are changing your injectors or the fuel pressure, then you may need to recalibrate a number of elements in the calibration.
This command can ease the task by adjusting the Fuel Map, the crank fuel table (crank injector time), the crank pulse table (initial crank pulse) and the secondary option (staged flow ratio).