Example Function Scripts
Example scripts for the function editor.
Generating a Logarithmic Axis
To generate an exponential axis on a map or table, you could use the following script:
var power = 2;
var m = x / (xcount - 1);

minvalue + range * Math.pow(m, power);
Adjusting the ‘power’ variable will adjust the curvature of the resulting axis:
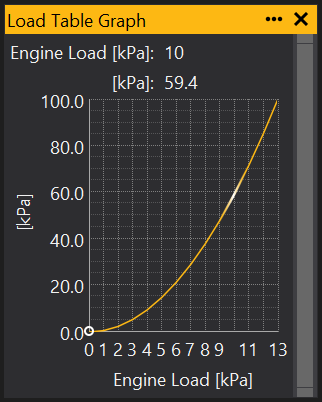
power = 1.5
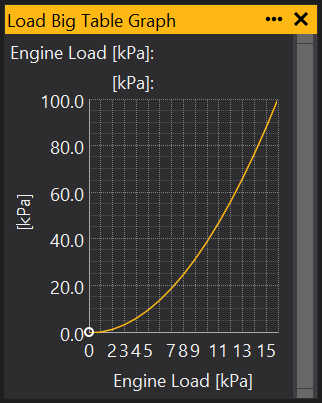
power = 2
Display Average of All Sites
To calculate the average of all sites and display it without modifying the map , you could use the following script.
This shows some more advanced scripting features.
// Loop over all sites and calculate a rolling average
let avg = 0;
let n   = 0;
let val = 0;
for (y = 0; y < ycount; ++y) {
    for (x = 0; y < ycount; ++y) {
        ++n;
        val = object.getReal(x, y);
        avg += (val - avg) / n;
    }
}

print("Average Value: " + avg.toString());
// Terminate the script:
completed = true;

// Set the result so that the object is not modified.
result = v;
This will display the average value of the map in a popup dialog box.