Some views are docked to the edges of the Workspace area and will be shown regardless of which tab is selected.
Docked views can be moved and re-docked via drag & drop. Just press and hold the left mouse button on the title bar of a docked view and drop it onto one of the dock targets that are shown during the drag & drop operation.
Views that are docked to the workspace are available from the following menu commands:
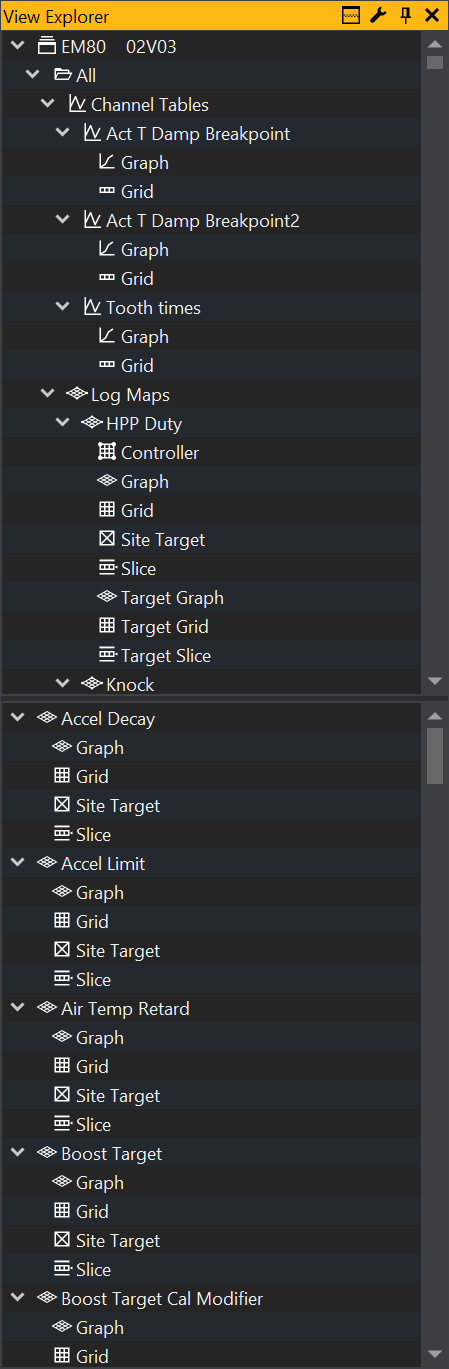
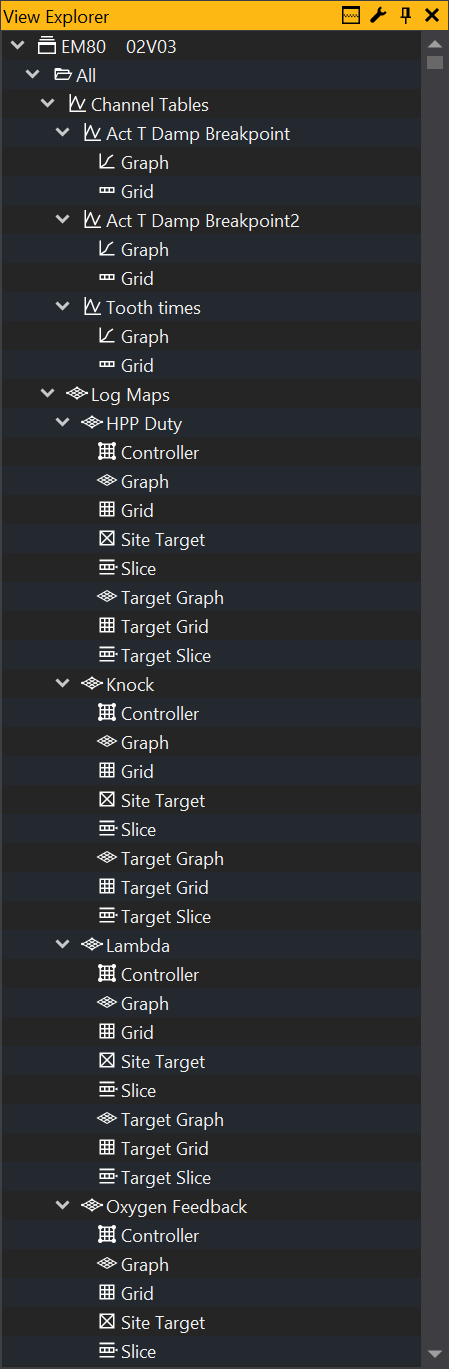
The View Explorer window is a tree view list of all maps, tables, options and channel that are in the current ECU type. The View Selector allows you to select any of these view objects and add them to a tab in your workspace.
The View Selector is made up of a number main folders. These are: Categorised, Profiles, All, and User. These folders all contain the maps, tables channels etc for the current ECU, but group them in different ways.
Categorised: Groups objects by their category i.e. Fuel, ignition, etc.
Profiles: Groups objects by the profile they are in (not available in all products). Profiles are used to distinguish common objects from those that are advanced or for security.
All: Displays all objects, grouped by their type i.e. Maps, tables, options etc.
User: By dragging and dropping objects from other folders the user can create their own structure for storing objects.
Adding an object to the workspace
Adding an object to the workspace using the views selector can be done either by dragging the object into the workspace or by right clicking the object and selecting display. For certain objects there are more than one option as the object can be displayed in more than one way. For example: right clicking on a map will give you the option to display as either a graph or grid.
Splitting the View Explorer
The View Explorer may be vertically split by using the views_split_button button:
This splits the view so that the children of the item selected in the top tree are displayed in the bottom panel. This can make navigating the views tree easier if you expand items with a large number of children.
Properties Window
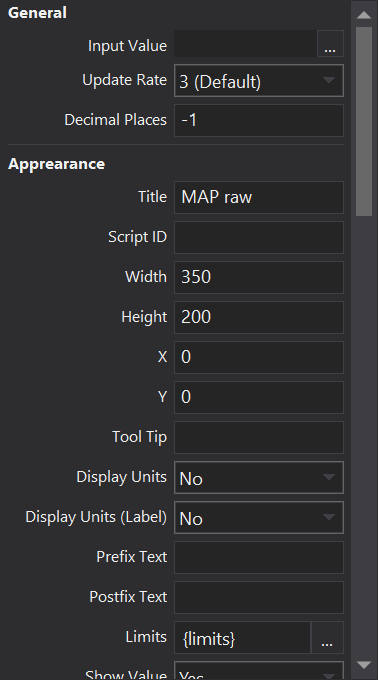
The Properties window displays a list of options and settings for the currently selected object in the workspace. By default it is displayed at the bottom right of the screen but if removed can be re-displayed by selecting it from the menu PropertiesAlt-Enter
Changing properties
The properties window will always display the properties for the last selected object in the workspace. So start by selecting the object in the workspace you want to change. This will fill the properties window with the options for that object. Then simply click on the setting you want to change and type a new value.
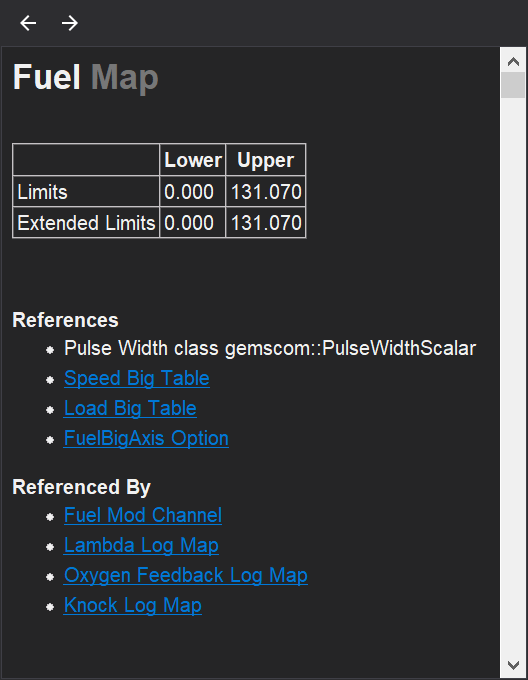
Property Description
The property description makes up the bottom part of the properties window. It displays a brief description of the currently selected property. In the picture above a description of the Multiplier property is shown. The description section can also be re-sized by clicking and dragging the line at the top description area.
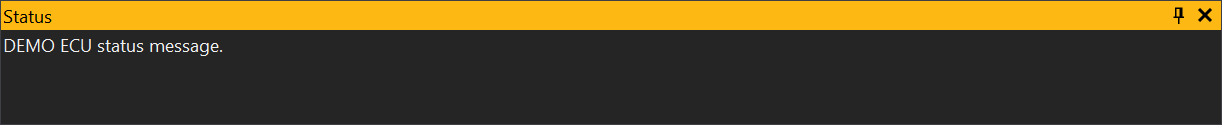
ECU Status Window
The ECU status window displays the current status of a connected ECU and any messages the occur during the connection process. This could be anything to conformation of a calibration upload to security checks.
By default the ECU status window is displayed at the bottom of the screen, but can be accessed again if removed from the menu ECU Status.
The status window may be suppressed from displaying automatically when connecting by setting the ‘Suppress ECU status popup’ property in the general settings (Preferences...Alt-F7> General) .
Explanation of some messages
Parity error - Is caused by the slight errors in the data received. May occur when ECU is switched off. If some are appearing but the ECU is still connected, it suggests that there is some noise on the communications cable. Either try another cable or move cable away from other electrical equipment. If multiple Parity Errors are being shown and the ECU is not connected, this suggests you connection settings are incorrect.
Framing error - Similar to Parity error.
Error: Rx Timeout - PC has stopped receiving communications from the ECU. Can occur if the ECU is switched off whilst connected.
ECU is not securable - The connected ECU does not have the ability to enable a password on the uploaded calibration.
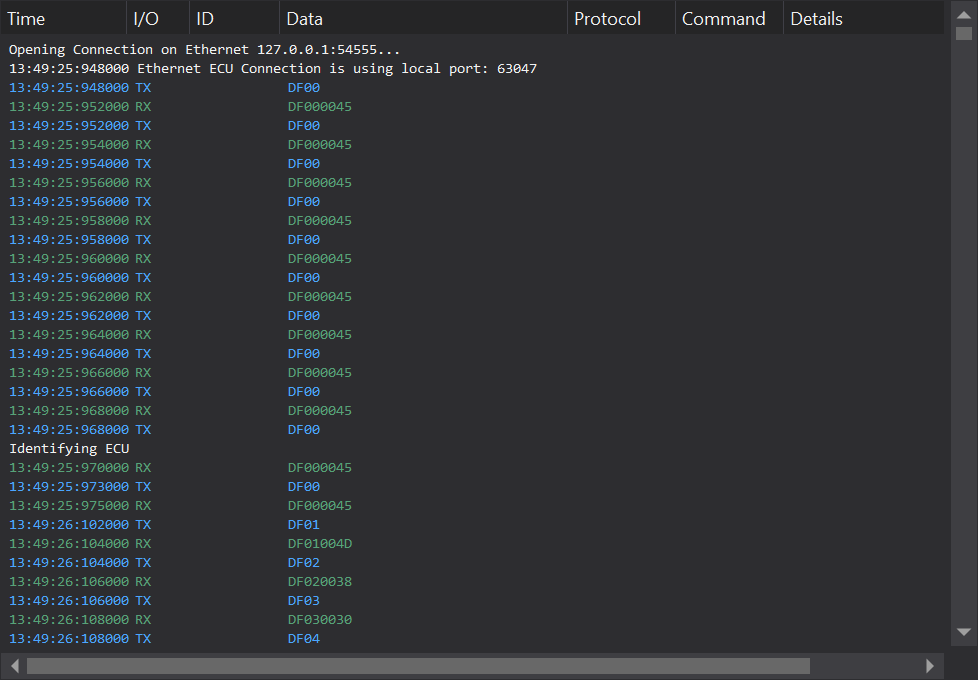
Comms Monitor
The Comms Monitor Window displays the raw data of the communications between GWv4 and the connected ECU.
Requests from the PC are displayed in blue text and prefaced by a “TX”. Responses from the ECU are displayed in green, and are prefaced by a “RX”.
 button: