Map & Table Functions
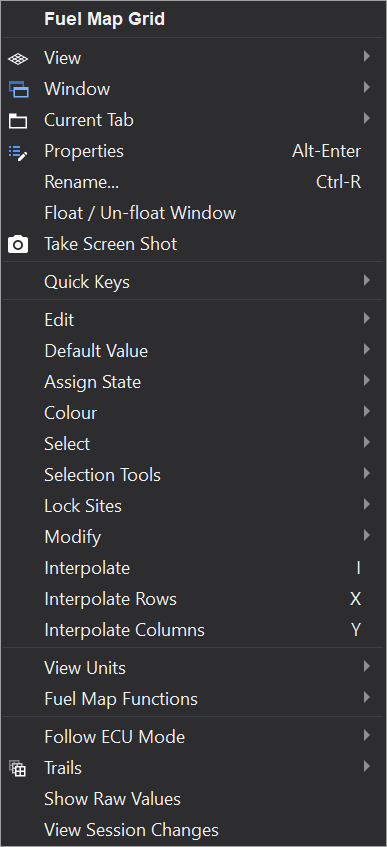
Various functions are available for map and table editing from the context menu.
To access the context menu, right click on the view (e.g. a Map Grid).
Alternatively, press the Context Menu key (to the right of Alt-Gr) whilst the view is focused. Some keyboards do not have a context menu key, in which case you can use Shift-F10.
Note
The context menu differs if you right click on the map/table axes of a grid view.
Common Functions
For Fuel Map specific function, see the Fuel Map Functions section.
View Grid / View Graph
Creates a new view window in the current tab for the same object (e.g. Fuel Map) with the alternative view type.
Properties
Displays/focuses the properties window for this object. Properties will be automatically updated to reflect what you are looking at. If the properties windows is hidden, then it will be shown.
Rename
Allows you to modify the title of the window.
Select All
Selects all sites in the focused object.
Select None
Clears the selection in the focused object.
Cut / Copy / Paste
Clipboard handling for the selected sites. Clipboard data may also be pasted into applications such as Microsoft Excel® and Open Office Calc®.
State | Set State to ‘Calibrated’ & State | Set State to ‘Unchanged’
Adjusts the state of the sites to either ‘Calibrated’ or ‘Unchanged’. To see state colours for a map or table, adjust the colour mode property using the properties window.
Lock Sites With Calibrated State
Locks sites that have the calibrated state from being modified.
For example, if you has set the state of a number of sites to ‘calibrated’, select all sites in the map and then adjust them using the [ or ] keys, the calibrated sites will not be modified.
Interpolate
Performs a two dimensional linear interpolation between the corner values of the selection.
Interpolate Rows / Interpolate Columns
Performs a one dimensional linear interpolation across rows or columns in the selection.
Percent Change
Adjusts the selected sites by a percentage of the current value:
x = x + (x \* percentage / 100)Negative percentages may be supplied to cause a reduction in the site values.
Absolute Change
Adjusts the selected sites by an absolute value:
x = x + valueFunction
Allows a user defined function to be performed on the selected sites.
The function can also be referred to as a script.
Simple functions may be written much like a mathematical expression, so no expert knowledge of programming is required.
For example, to make a percentage change of sites in a map, you might write:
v * 0.1If you click ‘Apply’, the function will be applied to the sites in the map. If you want the function to only be applied to the selection, tick the “Apply to Selection” box.
For more details, see the Function Editor section.
Smooth
Smooth applies a linear phase low pass filter to the map or table.
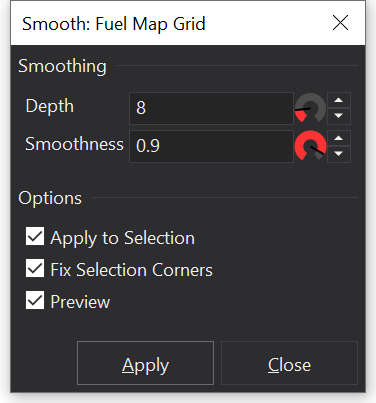
Depth corresponds to the window size of the filter kernel (each site being a sample). A Higher value will allow lower cutoff frequencies.
Smoothness corresponds to the cutoff frequency of the low pass filter. Higher values represent a lower cutoff.
Fill
Fills the map between selected sites or sites with the ‘calibrated’ state (see the State | Set to ‘Calibrated’ context menu command).
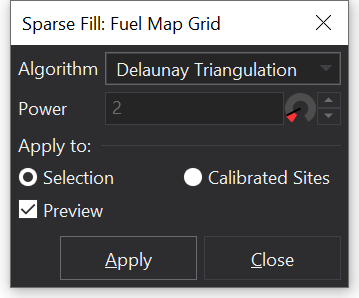
For more information, see the Fill Function section.
Show Raw Values
Displays the values in the map or table as raw (unscaled) hexadecimal values.
See also the Fuel Map Functions section.